Visual communication is becoming increasingly important for everyone in a fast-moving soundbite world.
GAMEChange methodologies use diagrams and drawing to help people capture and communicate the complexities of their own aspirations and strategies and enable people from all backgrounds to have an informed and meaningful contribution to individual and collective planning processes.

Visual Communication
Visual communication in GAMEChange methodologies has a number of elements that mutually reinforce each other:
Diagram Templates: Diagramming is a key element in creative and lateral thinking required for innovation. Diagrams provide a sophisticated and entertaining way of presenting very complex information that might take several pages to describe in words. The diagramming process also improves memory of information because the brain processes information in order to diagram, rather than just mechanically copying. Diagrams like organisational road maps, trees, circle maps and other types of diagram have been used in participatory development methodologies since the 1970s, including Participatory Rural Appraisal, REFLECT, Appreciative and many other. Concept and systems mapping are used to analyse and address very complex ‘wicked problems’ and encourage creative lateral and joined-up thinking in many organisations, including multinational companies, international aid agencies and scientific institutions. GAMEChange Diagram templates combine concept and systems mapping and diagrams commonly used in other participatory development processes have been adapted in very specific ways.
Drawing: Although diagramming does not necessarily use drawing, drawing often increases both the visual impact and also conceptual clarity on diagrams. Scientific research shows that drawing uses a different side of the brain to verbal language, and is linked to development of spatial intelligence, memory and even delaying dementia. In counselling drawing has been used to open up unconscious and hidden thoughts and judgements – an essential part of examining and changing our own attitudes and behaviours. In team-building processes it is used to develop spontaneity and encourage free and open discussion of ideas – including sensitive issues that may be hidden or avoided through using words like ’empowerment’ or ‘progress’.
Other forms of visual communication used in GAMEChange methodologies to further inspire and reinforce learning and change include:
- theatre and role play
- dance to accompany songs.
‘A picture is worth a thousand words’: potential power of pictorial communication:
- clarification of complex ideas and concepts
- immediate and memorable communication
- more information conveyed in a much smaller space and time
- resources accessible to all and more equal communication across inequalities of literacy and power
- reduced need for translation across national and international language barriers
However, despite the power of many of the pictorial outputs to clarify concepts and exchange important ideas and experiences for participants, using these drawings to communicate to people who did not participate presents a number of challenges.
But what do the pictures say? Pictorial communication challenges
- ‘symbols may be context-specific’ or specific to particular individuals
- ‘ the medium may not be the message’ : Many of the drawings and role plays are very immediate and expressive – including drawings by people who never held a pen before. But the drawing style and content may be by local availability of particular media (pencils/ biros/ markers, lined/blank/coloured paper, role play props). The participatory workshops are also very time-constrained where the aim is empowerment of participants, not ‘effective’ design. This means that the visual outputs may not do full justice to the messages and meanings they represent.
- ‘Just pretty pictures by illiterates’: Visual outputs are rarely in a form that is easily communicated to people who were not participating in the process. A lot of the impact of the community-level imagery is lost because lack of visual literacy by people with formal education – ie those in power – mean they often miss the deeper meanings and sophisticated analysis behind the drawings.

GAMEChange Diagram ‘DNA Templates’
All GAMEChange empowerment methodologies adapt a set of four diagram ‘DNA templates’.
Some of these originate in familiar tools – road maps, circles and tree diagrams – from other participatory methodologies. More complex diagrams draw on principles from concept and systems mapping and information graphics.
The GAMEChange diagram templates have evolved to incorporate underlying ethical principles including gender mainstreaming, and also principles of visual dynamics to increase clarity of communication. The associated adapted tools are used in very specific ways as systematic and cumulative toolsets in different GAMEchange processes.
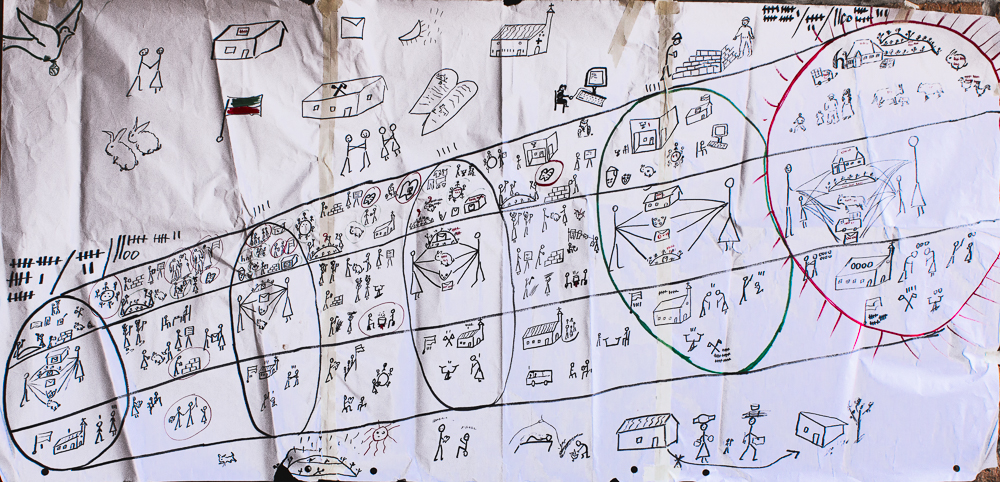
Change journeys

What are they? Road Journeys chart a journey from point a to point b, generally over time. Journeys may be forward-looking Vision Journey to the future, or an Achievement Journey from past to now. Roads may be single track or multi-lane for different issues.
Main uses: strategic planning (Vision Journey), impact assessment and evaluation (Achievement Journey and tracked Vision Journey).
Generic steps
A Vision Journey towards the future is the main tool:
- Vision
- Current circle and road framework with one or more lanes
- Opportunities and challenges
- Timebound SMART target and milestones
- Activities and achievement targets in the milestones on the way.
Vision Journeys then tracked progress over time with red ‘fruit circles’ around things achieved and other symbols marking things that prove more difficult. The Journey is then adjusted as required.
An achievement journey is similar but from present to past.
Action Trees

What are they? Trees show relationships between different types of inputs and outputs in order to identify actions and target achievements.
Main uses: challenge analysis (eg gender balance/happy family/leadership tree), business input/output trees, multi-stakeholder negotiation (win-win tree), impact assessment.
Generic steps
- Trunk representing an issue or an institution like a household or community with vision top and current circle bottom.
- Roots to show inputs or causes/dimensions/perspectives.
- Branches to show outputs or potential solutions.
- Symbols outside the trunk to show external forces and/or links between roots and branches.
- SMART Action Fruits as individual change commitments are shown on the branches, roots and/or trunk.
The action fruits are tracked and turn red as they ripen. Symbols are put against actions or targets that need more attention.
Relationship maps

What are they? Relationship maps show the common and distinct features between different elements eg people, institutions, markets, represented as circles and other shapes. Shapes can also be used for concept and systems mapping.
Main uses: empowerment mapping, stakeholder analysis, institutional mapping, decision-mapping, market and value chain mapping, impact assessment.
Generic steps
- Individual or target institution either as they want to be or as they currently are in a circle at the centre of the page
- Other elements are placed spatially far or near with different types of colour/line coding/shape.
- Linkages and interrelationships are shown with different types of arrow
- Elements or linkages to be strengthened or changed are marked with symbols representing action or by thick coloured circles.
As things change they are marked with a thick red circle as a ripe fruit or smiley face. Symbols are put against actions or targets that need more attention.
vision Diamonds

What are they? Diamonds show the degree of spread of values horizontally around an established norm or average. They can also show differences between stakeholders in columns vertically.
Main uses: Visioning and identifying change indicators (eg gender justice and CEDAW diamonds, poverty diamonds, leadership diamonds), family and multi-stakeholder negotiation and change contracts (win-win diamonds), impact assessment.
Generic steps
- Diamond framework, with horizontal value lines and vertical stakeholder lines.
- Individual brainstorm of positive indicators and negative indicators drawn on small cards, then shared as drawing energiser.
- Indicators grouped, ranked and placed in the appropriate part of the diamond and voted on.
- Action priorities are ringed.
- Plenary sharing different stakeholder perspectives to identify common indicators and potential lines of difference.
Achievement of action priorities are ringed as red fruits. Impact can also be shown retrospectively for individual indicators as mini-wiggly-road journeys.
One of the big advantages of drawings and diagrams over linear writing is that a lot of information can be captured in a much smaller space and interlinkages can be between different elements can be much more easily understood and communicated.
This requires paying attention to the visual dynamics and overall impression on the page. It is suggested that first drafts are done in pencil so that drawings can be easily rubbed out and altered. Or messy first drafts can be used for brainstorming, and redrafted once thinking is clear.
Diagram design
Once people doing the diagrams have some experience and confidence, thought should be given to:
- Spatial placement and position on the page in relation to other elements
- Size in relation to other elements to indicate hierarchy – or equality
- Shape that can differentiate between different categories
- Line that can differentiate between different categories and/or relationship
- Colour that can differentiate between different categories and/or relationship
Colour-coding for action planning and assessment
Many diagrams use colour coding in order to make the analysis and planning clear at a glance. Colour-coding may apply to pens and/or paper. To allow colour-coding of different participants eg women/men, staff/community etc as well as planning, tracking and monitoring.
Colour-coding for participants should seek to subvert cultural norms eg not using normal colours for women/men in order to encourage thinking about change.
For planning, tracking and monitoring it is good to follow the normal convention so that different processes can understand each other and avoid confusion:
Red = achieved
Green = planned or ‘unripe’
Black = indigenous, already existing
Blue = perished, not wanted, not relevant

Empowering Innovation:
Adapting Tools
Diagrams and drawing are only as empowering as the processes and institutions in which they are used. Diagrams are extremely flexible and can be adapted to any issue or context. The range of adaptations and types of information which may be represented on diagrams of any one type is very wide. Any one question can often be approached using more than one type of diagram or sequence of diagrams.
User innovation is a key feature of the GAMEChange methodology. Steps for the same tool type are consistent enough across issues for people to quickly learn to innovate and adapt themselves as new needs come up in their lives. Most tools go through a process of first elaboration and exploration starting with the generic form, and then progressive refinement as particular elements and relationships are judged more important or more interesting than others in the light of evidence or logical association. The examples in the GAMEChange practical manuals are by no means the only possibilities, and adaptation of the tools to new issues as they come up and the evolving needs and skills of participants will always be ongoing.
BUT although tools are very flexible, this does not mean to say that ‘anything goes’. Innovation in the tried and tested tools must be based on clear addition to empowerment – see Box.
Initially all participants need to develop drawing skills and everything should be drawn. But over time, as concepts and information become more complex eg quantification in thousands rather than tens, then if everyone is literate and speaks the same language then some short written words can be added. Usually people still choose to draw because more information can be added in a smaller space.
The main aim in any process is to keep things simple and use as few tools as absolutely necessary so that people can focus on the issues and not distracted by having to learn lots of new tools. It is also important that diagrams are used in a logical sequence with clear linkages between them. Some processes have become derailed and confused by staff or consultants trying to ‘make their mark’ by inventing a new tool, rather than looking at the issue and then seeing how tools people already know can be adapted. Introducing many new tools has often become very disjointed with little thematic learning link between them.
Once the process is well established, or for very specific purposes, other types of diagram like calendars, flowers, maps and matrices can also be added. The most interesting and useful ones are generally those invented by people themselves for their own use.
Empowerment innovation checklist
- Start with vision – is there an inspiring focus? even the current situation should be looked at in relation to a vision
- Think positive – Have as many positive opportunities for change been identified as possible?
- Foresee challenges but don’t get too bogged down – Have challenges and power relations been identified?
- Act SMART from Day 1 ALWAYS identify immediate action steps and SMART target/s
- Track, reflect and learn – all diagrams are to be used for learning how to advance. Have people decided how they will do this? What symbols will they use to track? When will they do it? How will they learn?
- Share with others – few people can succeed alone. Are people clear enough about the steps to share with others?
- Changing power relations – have differences between stakeholders eg gender/age/ethnic dimensions been discussed in all the above?
Innovation principles
- User-led: innovation and ongoing adaptation must be led by those using them – not imposed by staff and consultants without listening carefully.
- Start simple: tools should initially be simple enough for the users, including people who cannot read and write, to understand how to use and share the tools in a very short time – often only 10 minutes.
- Sophisticated enough to really help people think through and analyse their complex reality and possible strategies to change.
- Coherent and cumulative learning process. All tools must be clearly linked to each other, adding information and enabling tracking and sharing.

Further Resources
Equal and Together 3 Why Diagrams and Diagram Overview, IFAD 2013
The following posts on Linda Mayoux Visual Communications degree blog that started to develop animations from the community processes look at issues of understanding, interpreting and communicating the stories from community workshops in Uganda, India and Pakistan.