If we want to succeed we need to work with other like-minded people. If our visions are big, we cannot achieve them alone. Even working towards small visions is more fun and quicker to progress if we are working with other people to share ideas, experience and to laugh with.
If we want to succeed we will also need to negotiate with those who may not immediately agree with us. We need to identify ways of working with these people and convincing them to support us.
If we share the methodology with others who may listen to us in our families and communities we can also become a leader of change.
GAMEChange Empowerment Maps systemically analyse webs of interrelationship within and between families, communities, organisations and networks, mapping stakeholders and power relations.
Empowerment map adaptations include detailed analysis and tracking of stakeholder interactions, social support networks, different types of power inequality, leadership and peer sharing strategies, markets and value chains, institutions for advocacy campaigns.

Empowerment Map:
Diagram Template


What are Empowerment Maps?
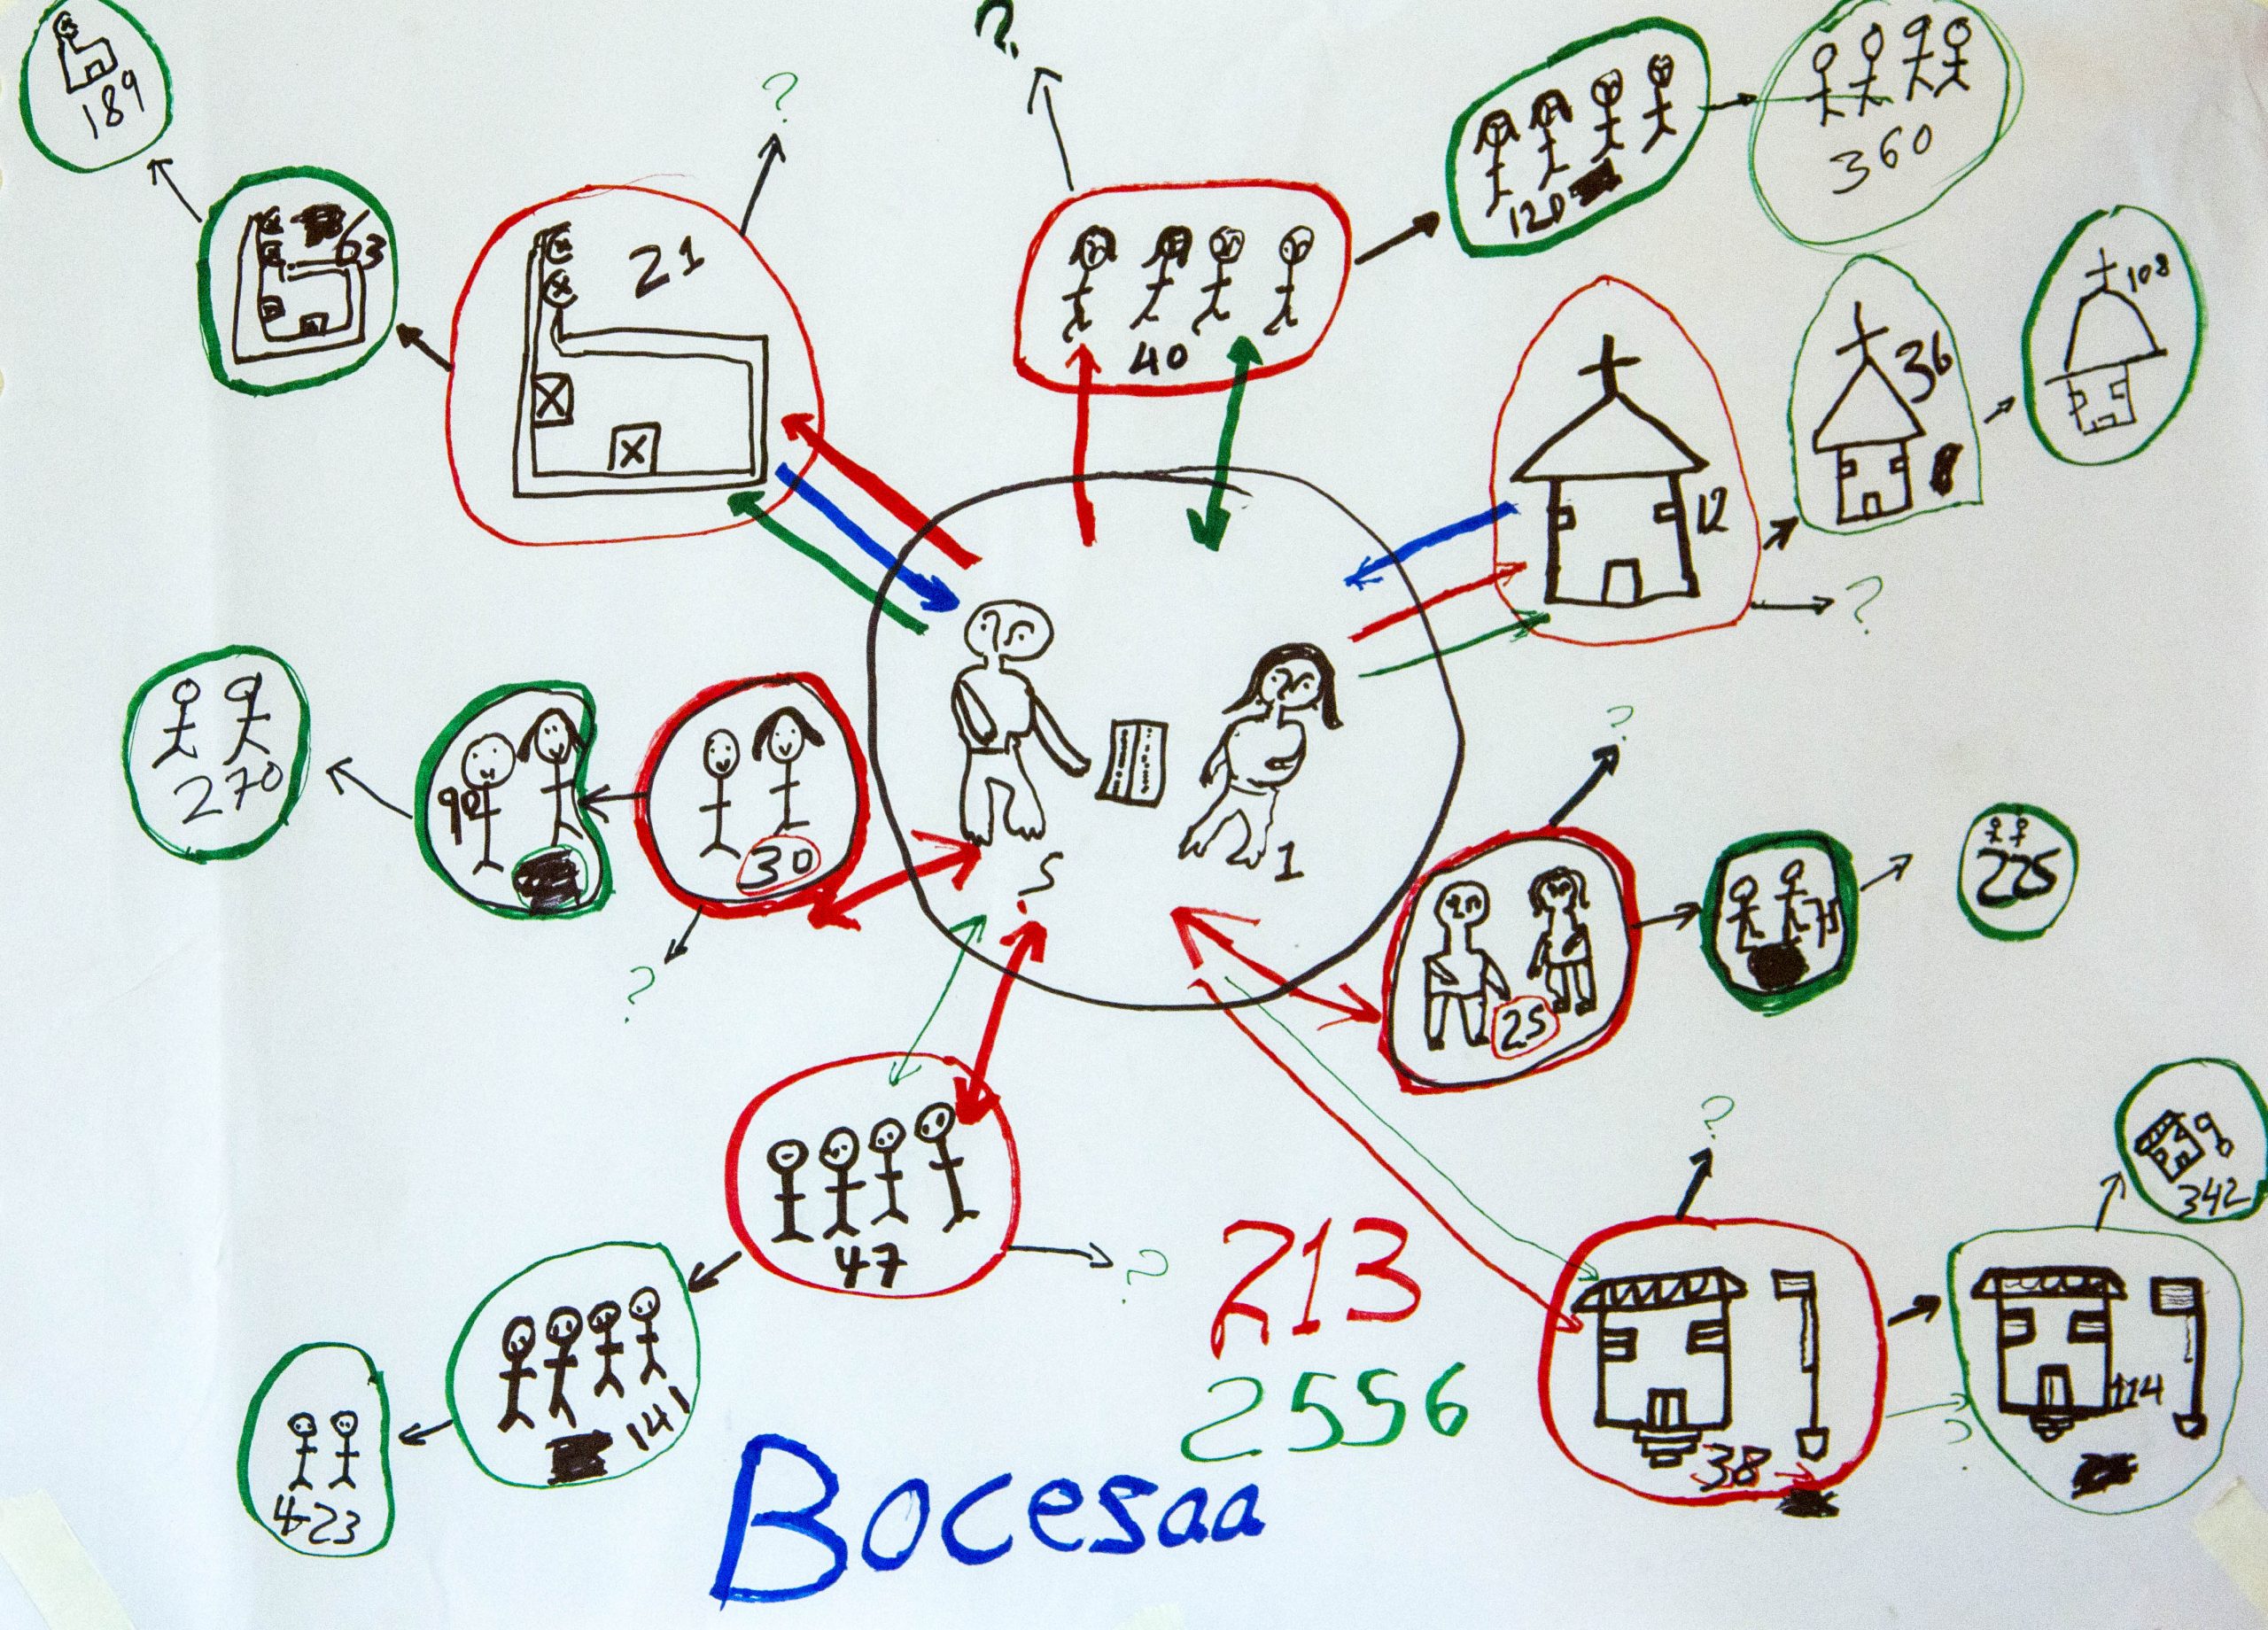
GAMEChange Empowerment Maps help participants to see ‘the bigger picture’ of people, institutions and forces that present opportunities and challenges to achieving their visions. They build on adapt concept and systems mapping principles and established diagram tools like Circle, Venn or chapati diagrams and systems maps that have been common in participatory methodologies and natural and social sciences since the 1970s. For individuals and organisations they enable analysis of very complex ‘wicked problems’ and encourage creative lateral and joined-up thinking about potential ways forward.
GAMEChange Empowerment Maps combine and clarify on one diagram:
- elements of very complex ‘web’ systems as symbols and shapes around the central ‘spider’ working for change
- different types of interrelationship: as lines, arrows and boundaries connecting the elements
- entry points, priorities and strategies for change: colour-coding priority support and peer sharing networks to be strengthened or change with specific timeframes.
- changes tracked over time: colour-coding different elements, their relationship and achievements/challenges in strategies used
Participants add more details or draw new update maps as they gain experience. This helps them to reflect on strategies that can strengthen positive elements or relationships and address negative challenges.
Empowerment Map adaptations
- Empowerment Leadership Map: analyses support networks and power relations to plan and how to work towards a vision, including peer sharing of tools to help others.
- Market and value chain map: identifies possibilities for market diversification and increasing gender inclusion in markets:
- Financial resource mapping: identifies the range of different sources of finance and their opportunities and challenges.
- Stakeholder analysis
- Institutional governance mapping: institutional governance map to look at inter-organisational decision-making and power relations and how they can be changed.
- Institutional advocacy mapping: mapping powerful institutions and strategies to influence them.
- Information Systems mapping: to look at information flows and structures of power and transparency within and between organisations.
- Concept mapping: shapes can represent different dimensions of a concept, showing how they are related and which are most important.
Web elements:
symbols and shapes
Mapping the elements of a web system or concept make use of the whole surface available:
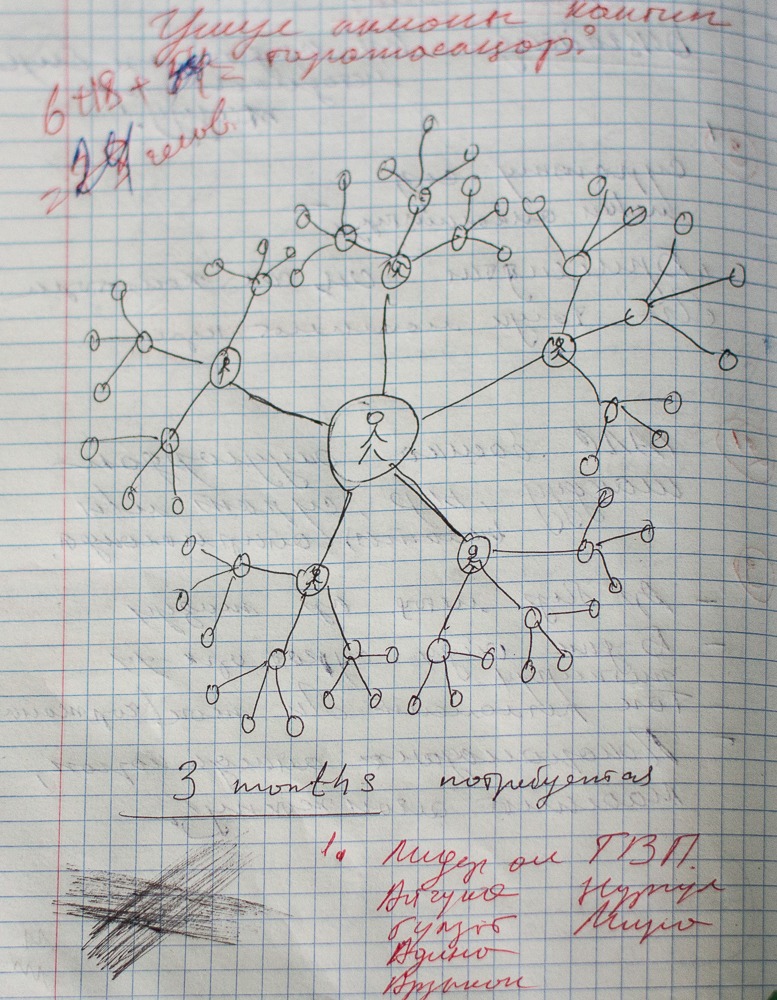
- a web system may radiate out from a single middle person, institution or concept or they may have several different starting ‘spiders’.
- shapes or symbols clarify common and distinct features between different elements eg people, institutions, markets.
- colours, shapes and/or symbols clarify which elements are similar and which are different.
- position on the page clarify elements as isolated, groups and/or overlapping elements, elements inside or next to other elements.
These web systems can be as simple or as complex as required by the issue and/or capacities of the ‘spiders’.
Interrelationships:
lines arrows and boundaries
The types of interrelationship between the elements are shown as lines and arrows of:
- different direction: to and/or from the spider and/or between elements
- different colour: for different types of relationship eg love/friendship, money, power
- different thickness: for the strength of the relationship
Living Maps:
Action learning/building networks
Living action learning map that is revisited, tracking progress, analysing what works and does not work, and and tracked over time, not left in a drawer until the next workshop or visit by the donor.
Consistent colour coding so that the map and action plan remain clear. It is best to start with a draft in pencil, but then distinguish:
- red ‘ripe fruits’ as drawings and/or circles for vision and achievements/actions done.
- black ‘native fruits’ as drawings and/or circles for what was already ‘in the culture’ – good and bad.
- green ‘unripe fruits’ are drawings and/or circles of positive things/actions planned but not yet achieved. Green fruits should always be there – once one fruit is ripe, think of some new green fruits to grow more.
- blue ‘perished fruits’ are drawings, crosses and/or circles for things/actions to be avoid in future, that you no longer want or you know now from experience will not work.
Sharing the maps:
leadership and Movement building
Empowerment maps build networks and develop leadership.
- Share the steps with other people in your households, communities and networks so that they can do their own map. Their map should follow the same steps, but must be be their map, not anyone else’s.
- Meet together regularly to share experiences of what works and what does not work.
- Develop collective plans over time for individual and collective actions to support each other – change starts with the individual, that is where you have responsibility and some control, But not all things can be done alone. And not everything should be just for you if you want a community, society or world that is good to live in.
IMPORTANT NOTE: some maps must remain confidential, particularly those showing interpersonal relationships. Always ask people before looking at their maps or asking them to share.


Change Leadership Map
Developed in 2017 for SNV Ethiopia with Sara de Smet and SNV staff and champions as part of a PALS Toolkit for Gender and Youth in Horticulture Markets project.
Leadership Web
Developed in 2020 for Oxfam Novib with Katja Koegler and partners in Mali, Niger and Pakistan for Marriage is No Child’s Play project.
Business Innovation Market Map
Developed in 2019 for IFAD with Asel Kuttubaeva for Business Action Learning for Innovation (BALI) methodology as part of IFAD’s Rural Women Economic Empowerment Joint Project in Kyrgyzstan
Financial Empowerment Map
Developed in 2017 for Oikocredit with Intan Dharmawati, Malou Juanito and partners NWTF and ASKI in Philippines for Financial Action Learning System (FALS) methodology as part of Oikocredit’s Bridging the Gender Gap in Responsible Finance project.